Visualizing explicit and implicit relations of complex information spaces
Article
Dörk, M., Carpendale, S., & Williamson, C. (2012). Visualizing explicit and implicit relations of complex information spaces. Information Visualization, 11(1), 5-21.
Two of the most popular techniques for visualizing relations are node-link diagrams (NLD) and multidimensional scalling (MDS). NLD techniques usually are applied to explicit relations or connections that are visualized as edges between nodes representing (for example) online communities, computer networks or linked web pages. MDS is typically used for implicit relations between documents or other types of MDS data.
http://innovis.cpsc.ucalgary.ca/innovis/uploads/Research/EdgeMaps/edgemaps.mp4
Explicit relations are data relations that specifically connect data entities and are already present in the data set
Implicit relations are data relations that are not defined in the data set and need to be inferred based on similarities between data items.
Both NLD and MDS have limitations with regard to readability and interpretability of the resulting visualization. EdgeMaps, or integrated views that combine graph drawing and spatialization, can be used to visualize these relationships. EdgeMaps integrate NLD and MDS techniques utilizing both visual linkage and proximity for the representation fo complex relations between items.
Design goals for EdgeMaps include: integrate multiple relationships, show invisible data patterns, display additional information, and provide aesthetic visuals.
Implicit relations as layout: to represent implicit relations, two layouts are used Similarity Map and Timeline
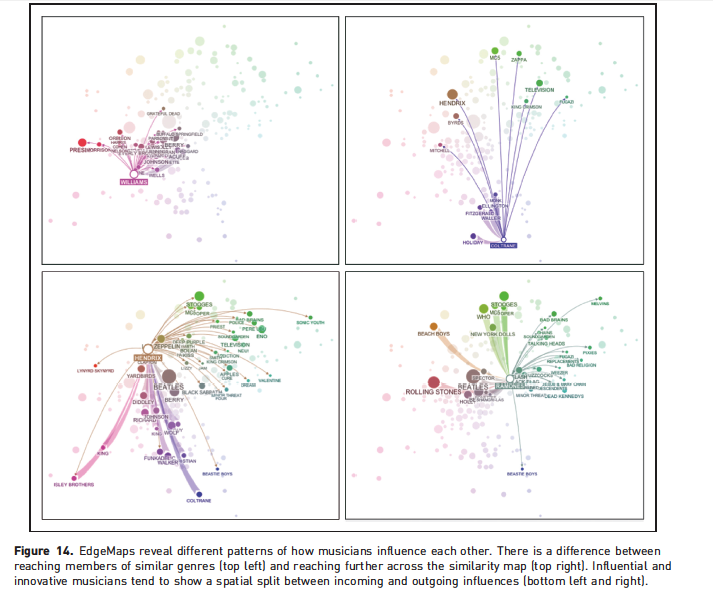
Explicit relations as curved edges: to represent explicit relations, directed edges are drawn between nodes. There are two types of influence Incoming influence and Outgoing influence. To visually differentiate between edge types, Curvature, directionality, shape, opacity, and colour are used)
Redundancy through Size and Colour: Edge maps visualize data sets primarily using position to represent implicit relations and edges to represent explicit relations, but secondary visual variables including node size and colour can accentuate significance and similarity of date items.
Yarn Balls vs. Fireworks and Waves: Instead of displayign many edges that make readability more and more difficult with increased nodes and edges, its better to use colour, position, and size for nodes to provide context and overview.
Creating a web-based visualization interface: interacting with the visualization, visual information design, web integration and native graphics
Challenges for EdgeMaps: Edge Congestion, Overlapping nodes, Aggregating Nodes, Spatialization, Folding Time, and Layouts,